2 Chapter 2: Clean Data
Early draft release: This chapter hasn’t been fully edited yet.
In this chapter, we’ll explore how to clean data using PySpark within Microsoft Fabric. Data cleaning is one of the most critical phases in any data engineering workflow. Even the most sophisticated analytics will produce misleading results if built upon dirty data. Let’s learn how to prepare our data for reliable analysis using Microsoft Fabric’s PySpark capabilities.
2.1 Understanding Data Quality
Before diving into specific cleaning techniques, it’s important to understand what makes data “dirty” and why cleaning is essential. Within Microsoft Fabric’s lakehouse environment, you’ll often integrate data from multiple sources, each with its own quality issues.
Let’s first create a sample DataFrame to work with throughout this chapter:
# Import necessary libraries
from pyspark.sql import SparkSession
from pyspark.sql.functions import *
from pyspark.sql.types import *
import random
import datetime

# In Microsoft Fabric, SparkSession is already available as 'spark'
# No need to create a new one as you might in standalone Spark

# Create a sample DataFrame with quality issues for demonstration
data = [
    (1, "John Doe", None, "2023-01-15", 35000, "Sales"),
    (2, "Jane Smith", "jane.smith@example.com", "2023-02-20", 42000, "Marketing"),
    (3, None, "mark.johnson@example.com", "2023-03-10", -5000, "Engineering"),
    (4, "Sarah Williams", "sarah.williams@example.com", "2023-04-05", 38000, "Sales"),
    (5, "Michael Brown", "michael.brown@example.com", "2023-04-05", 38000, "Sales"),
    (6, "Michael Brown", "michael.brown@example.com", "2023-04-05", 38000, "Sales"),
    (7, "Lisa Davis", "invalid_email", "2023-05-20", 41000, "Marketing"),
    (8, "Robert Wilson", "robert.wilson@example.com", "not_a_date", 39500, "Engineering"),
    (9, "Emma Garcia", "emma.garcia@example.com", "2023-06-12", None, "Marketing")
]

# Define the schema
schema = StructType([
    StructField("employee_id", IntegerType(), True),
    StructField("name", StringType(), True),
    StructField("email", StringType(), True),
    StructField("hire_date", StringType(), True),
    StructField("salary", IntegerType(), True),
    StructField("department", StringType(), True)
])

# Create DataFrame
df = spark.createDataFrame(data, schema)

# Display the DataFrame
display(df)
2.2 Using Data Wrangler in Microsoft Fabric
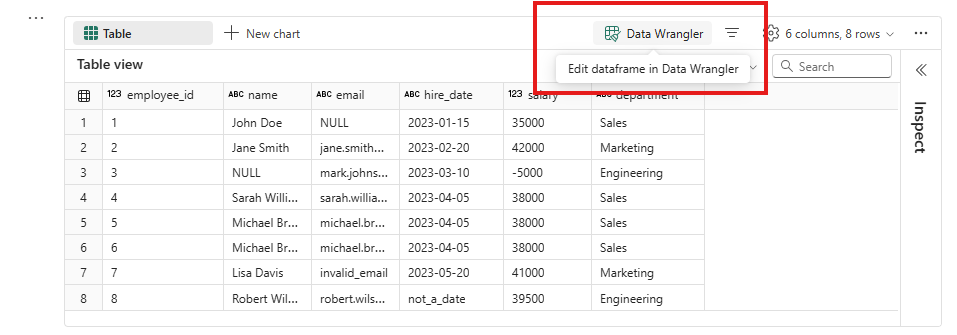
Microsoft Fabric provides an interactive Data Wrangler feature within the notebook experience that allows you to visually inspect and clean your data. This is especially helpful for data engineers who are new to PySpark.
To access Data Wrangler in Fabric:
- Run a cell that displays your DataFrame (using
display(df)) - Click on the “Data Wrangler” button that appears in the output
- Use the graphical interface to explore and transform your data
Data Wrangler allows you to perform many common cleaning operations without writing code: - Filter rows - Remove or fill null values - Format strings - Change data types
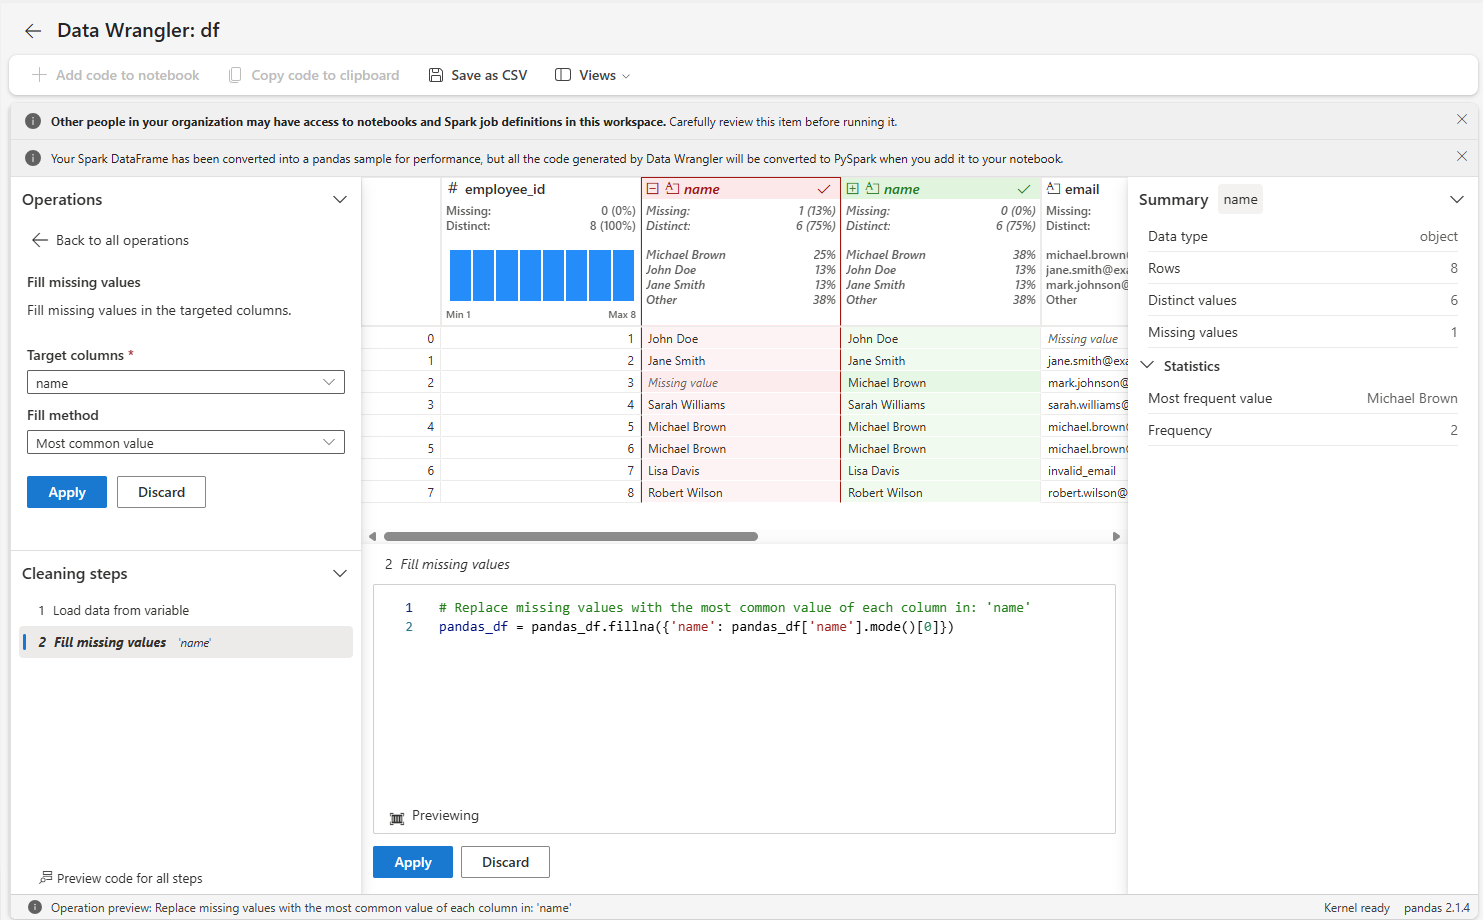
After making changes in Data Wrangler, you can generate the corresponding PySpark code, which you can then incorporate into your notebook.
Let’s continue with programmatic approaches, which give you more control and are essential for production data pipelines.
2.3 Identifying Data Quality Issues
2.3.1 Types of Dirty Data
Let’s examine common quality issues in our sample data.
You should really use Data Wrangler for this while doing exploratory analysis. It has a better UI than the results of this code. However, this code could be useful if you want to have logs in your data pipelines. We’ll see later that you can schedule the execution of a notebook. On any previous run, you are able to see the notebook with all the results. Including this in your notebooks can help you spot data quality issues on a specific notebook run.
# Check for nulls in each column
null_counts = df.select([count(when(col(c).isNull(), c)).alias(c) for c in df.columns])
display(null_counts)

# Check for duplicates
duplicate_count = df.count() - df.dropDuplicates().count()
print(f"Number of duplicate rows: {duplicate_count}")

# Validate email format using regex pattern
invalid_emails = df.filter(~col("email").rlike("^[A-Za-z0-9._%+-]+@[A-Za-z0-9.-]+\\.[A-Za-z]{2,}$") & ~col("email").isNull())
print("Invalid email formats:")
display(invalid_emails.select("employee_id", "name", "email"))

# Identify out-of-range values (negative salaries)
anomalies = df.filter(col("salary") < 0)
print("Anomalies in salary:")
display(anomalies.select("employee_id", "name", "salary"))

# Check for invalid dates
from pyspark.sql.functions import to_date
invalid_dates = df.filter(to_date(col("hire_date"), "yyyy-MM-dd").isNull() & ~col("hire_date").isNull())
print("Invalid date formats:")
display(invalid_dates.select("employee_id", "name", "hire_date"))
2.3.2 The Impact of Quality Issues
Data quality issues can significantly impact your analyses within Microsoft Fabric:
- Nulls can cause calculations to return unexpected results or errors
- Duplicates can skew aggregations and statistical analyses
- Invalid formats (emails, dates) can break downstream transformations
- Anomalies (like negative salaries) can produce misleading insights
This is especially important in Microsoft Fabric, where data may flow through multiple services like Data Factory pipelines, Power BI reports, or ML models.
2.3.3 Understanding the Shape of Your Data
Let’s examine our data’s structure and distribution:
# Get basic DataFrame info
print(f"Number of rows: {df.count()}")
print(f"Number of columns: {len(df.columns)}")
print("\nSchema:")
df.printSchema()

# Get summary statistics for numeric columns
print("\nSummary Statistics for Numeric Columns:")
df.select("employee_id", "salary").summary().show()

# Distribution of categorical data
print("\nDepartment Distribution:")
df.groupBy("department").count().orderBy("count", ascending=False).show()

# Check for imbalance in the data
print("\nPercent of rows by department:")
dept_counts = df.groupBy("department").count().withColumn(
    "percentage", round(col("count") * 100 / df.count(), 2)
)
display(dept_counts)
Understanding the shape and distribution of your data helps you make informed decisions about which cleaning strategies to apply.
Doing this analysis on millions (or billions) of rows could be quite expensive. If you have a very large dataset, we usually run this over a small portion. Could be a percentage (like 1%) or a fixed number (10 000 first rows).
Please be aware that, depending on your dataset, using only the first 1% or the last 1% may not give you an accurate picture.
2.4 Data Cleaning Techniques in PySpark
Now that we understand our data quality issues, let’s apply specific cleaning techniques using PySpark
2.4.1 Handling Missing/Null Values
Microsoft Fabric’s PySpark offers several strategies for handling nulls:
# Strategy 1: Remove rows with nulls in specific columns
# This is appropriate when nulls make the record unusable
df_no_nulls = df.na.drop(subset=["name"])
print("After removing rows with null names:")
display(df_no_nulls)

# Strategy 2: Fill nulls with default values
# Good for cases where a reasonable default exists
defaults = {"name": "Unknown", "email": "no_email@company.com"}
df_filled = df.na.fill(defaults)
print("After filling nulls with defaults:")
display(df_filled)

# Strategy 3: Fill nulls with computed values
# Calculate median salary and use it to replace nulls
# In Microsoft Fabric, we can use SQL for complex aggregations
df.createOrReplaceTempView("employees")
median_salary = spark.sql("SELECT percentile_approx(salary, 0.5) as median FROM employees").collect()[0]["median"]

# Then apply the calculated value
df_computed = df.fillna({"salary": median_salary})
print(f"After filling null salaries with median ({median_salary}):")
display(df_computed.select("employee_id", "name", "salary"))
2.4.2 Removing Duplicates and Outliers
Duplicates and outliers can significantly skew your analysis results:
# Remove exact duplicates (all columns match)
df_no_dupes = df.dropDuplicates()
print("After removing exact duplicates:")
display(df_no_dupes)

# Remove duplicates based on subset of columns
# For example, same person (name and email) should not appear multiple times
df_unique_people = df.dropDuplicates(["name", "email"])
print("After removing duplicates based on name and email:")
display(df_unique_people)

# Identify and handle outliers
# Calculate statistics to identify outliers in salary
from pyspark.sql.functions import stddev, avg

# Get statistics
stats = df.select(
    avg("salary").alias("avg_salary"),
    stddev("salary").alias("stddev_salary")
).collect()[0]

avg_salary = stats["avg_salary"]
stddev_salary = stats["stddev_salary"]

# Define outlier thresholds. On large datasets, a common practice is
# ±3 standard deviations. On a tiny sample like ours, the extreme value
# itself inflates the standard deviation, so we use ±2 here to make the
# anomaly visible.
lower_bound = avg_salary - 2 * stddev_salary
upper_bound = avg_salary + 2 * stddev_salary

# Filter out or cap outliers
df_no_outliers = df.filter((col("salary") >= lower_bound) & (col("salary") <= upper_bound))
print(f"After removing salary outliers (outside range {lower_bound:.2f} to {upper_bound:.2f}):")
display(df_no_outliers)

# Alternative approach: cap outliers instead of removing them
df_capped = df.withColumn(
    "salary_capped",
    when(col("salary") < lower_bound, lower_bound)
    .when(col("salary") > upper_bound, upper_bound)
    .otherwise(col("salary"))
)
print("After capping salary outliers:")
display(df_capped.select("employee_id", "name", "salary", "salary_capped"))
Two details worth noting. First, the standard deviation method assumes roughly normally distributed data; for skewed distributions, the interquartile range (IQR) method — flagging values beyond 1.5 × IQR from the quartiles — is more robust. Second, the range filter above also drops rows where salary is null, because comparisons with null evaluate to null: handle missing values before filtering outliers if you want to keep those rows.
There are a lot of cases where you would want to anonymize a dataset. Removing outliers is probably one of the first good steps. However, data anonymization is a very complex endeavor. In a Fabric world, some anonymization needs can be replaced by row/column level security - which is a feature preventing certain users from accessing some rows or columns - or dynamic data masking - that replaces part of specific rows for specific users, like masking all excepts the last four digits of a credit card number. It allows customer support agents to match a credit card, but prevent them from reusing this information.
2.5 Transforming Data Types and Formats
Microsoft Fabric’s PySpark allows you to convert data types and standardize formats, which is crucial for consistent analysis.
2.5.1 Converting Columns to Appropriate Types
We already saw in Chapter 1 that PySpark could infer the datatypes of the files you load, and that you can check a DataFrame columns datatypes with the method printSchema(). In the following code, we will see two prime examples of type conversion: Dates and decimal values. We’ll also see how to manage conversion errors.
# Convert string date to proper date type
df_typed = df.withColumn(
    "hire_date_formatted",
    to_date(col("hire_date"), "yyyy-MM-dd")
)

# Handle conversion errors by providing a default date for invalid formats
from datetime import datetime
default_date = datetime.strptime("1900-01-01", "%Y-%m-%d").date()

df_typed = df_typed.withColumn(
    "hire_date_clean",
    when(col("hire_date_formatted").isNotNull(), col("hire_date_formatted"))
    .otherwise(lit(default_date))
)

print("After converting date strings to date type:")
display(df_typed.select("employee_id", "name", "hire_date", "hire_date_formatted", "hire_date_clean"))

# Convert salary to decimal for more precise calculations
from pyspark.sql.types import DecimalType

df_typed = df_typed.withColumn(
    "salary_decimal",
    col("salary").cast(DecimalType(10, 2))
)

print("After converting salary to decimal type:")
display(df_typed.select("employee_id", "name", "salary", "salary_decimal"))
2.5.2 Validating and Standardizing Data
Standardizing data ensures consistency across your dataset:
# Standardize email addresses to lowercase
df_std = df.withColumn(
    "email_std",
    lower(col("email"))
)

# Validate email format and mark invalid ones
df_std = df_std.withColumn(
    "is_valid_email",
    when(col("email").rlike("^[A-Za-z0-9._%+-]+@[A-Za-z0-9.-]+\\.[A-Za-z]{2,}$"), True)
    .otherwise(False)
)

# Replace invalid emails with a placeholder
df_std = df_std.withColumn(
    "email_clean",
    when(col("is_valid_email") == True, col("email_std"))
    .otherwise(lit("invalid@placeholder.com"))
)

print("After standardizing and validating emails:")
display(df_std.select("employee_id", "name", "email", "email_std", "is_valid_email", "email_clean"))

# Standardize name format (Title Case)
df_std = df_std.withColumn(
    "name_std",
    initcap(col("name"))
)

print("After standardizing names:")
display(df_std.select("employee_id", "name", "name_std"))
2.6 Using Built-in Functions for Cleaning
Microsoft Fabric’s PySpark implementation includes a rich set of built-in functions specifically designed for data cleaning tasks.
2.6.1 Overview of Common PySpark Functions
Let’s explore some of the most useful functions for data cleaning:
# Data type validation and conversion
from pyspark.sql.functions import isnan, isnull, when, coalesce

# String manipulation and cleaning
from pyspark.sql.functions import trim, upper, lower, regexp_replace, regexp_extract

# Handling nulls and defaults
from pyspark.sql.functions import nvl, nullif

# Date and time functions
from pyspark.sql.functions import current_date, datediff, months_between, date_format

# Let's apply some of these functions to clean our data
df_clean = df.withColumn(
    # Trim whitespace from all string columns
    "name_clean", trim(col("name"))
).withColumn(
    # Replace nulls with a default value
    "email_clean", coalesce(col("email"), lit("no_email@company.com"))
).withColumn(
    # Convert to date type and handle invalid formats
    "hire_date_clean",
    coalesce(to_date(col("hire_date"), "yyyy-MM-dd"), lit("1900-01-01").cast("date"))
).withColumn(
    # Make sure salary is not negative
    "salary_clean",
    when(col("salary") < 0, 0).otherwise(col("salary"))
).withColumn(
    # Standardize department names
    "department_clean",
    initcap(trim(col("department")))
)

print("After applying multiple cleaning functions:")
display(df_clean)
2.6.2 Examples and Best Practices
Let’s put together a comprehensive cleaning pipeline based on best practices:
def clean_employee_data(df):
    """
    Comprehensive cleaning function for employee data
    """
    from pyspark.sql.functions import (
        col, when, coalesce, to_date, trim, lower,
        initcap, regexp_replace, lit
    )

    # Step 1: Remove exact duplicate rows
    df_clean = df.dropDuplicates()

    # Step 2: Handle missing values
    df_clean = df_clean.na.fill({
        "name": "Unknown Employee",
        "department": "Unassigned"
    })

    # Step 3: Clean and standardize string columns
    df_clean = df_clean.withColumn("name_clean", initcap(trim(col("name"))))

    # Step 4: Validate and clean email addresses
    email_pattern = "^[A-Za-z0-9._%+-]+@[A-Za-z0-9.-]+\\.[A-Za-z]{2,}$"
    df_clean = df_clean.withColumn(
        "email_clean",
        when(
            col("email").rlike(email_pattern), lower(trim(col("email")))
        ).otherwise(lit("invalid@placeholder.com"))
    )

    # Step 5: Convert and validate dates
    df_clean = df_clean.withColumn(
        "hire_date_clean",
        coalesce(
            to_date(col("hire_date"), "yyyy-MM-dd"),
            lit("1900-01-01").cast("date")
        )
    )

    # Step 6: Handle invalid numeric values
    df_clean = df_clean.withColumn(
        "salary_clean",
        when(col("salary").isNull() | (col("salary") < 0), 0)
        .otherwise(col("salary"))
    )

    # Step 7: Standardize categorical values
    df_clean = df_clean.withColumn(
        "department_clean",
        initcap(trim(col("department")))
    )

    return df_clean

# Apply the comprehensive cleaning function
df_final = clean_employee_data(df)
print("Final cleaned dataset:")
display(df_final)
2.6.3 Best Practices for Data Cleaning in Microsoft Fabric
When cleaning data in Microsoft Fabric using PySpark, consider these best practices:
Document your cleaning transformations: Add detailed comments to your code to explain why certain cleaning decisions were made.
Create reusable cleaning functions: As demonstrated above, package your cleaning logic into functions that can be reused across different notebooks.
Validate after cleaning: Always validate that your cleaning operations achieved the expected results.
Preserve raw data: In Microsoft Fabric, create separate tables or views for raw and cleaned data instead of overwriting.
Use Data Wrangler for exploration: Start with Data Wrangler to explore and understand your data before writing custom PySpark code.
Monitor cleaning performance: For large datasets, monitor the performance of your cleaning operations within Fabric’s notebook environment.
Incrementally clean data: For large datasets, consider cleaning data in batches using Fabric’s Delta tables.
Let’s validate our cleaning results:
# Check for any remaining nulls
remaining_nulls = df_final.select([count(when(col(c).isNull(), c)).alias(c) for c in df_final.columns])
display(remaining_nulls)

# Verify data types
print("Schema after cleaning:")
df_final.printSchema()

# Verify value distributions after cleaning
print("Distribution of departments after cleaning:")
df_final.groupBy("department_clean").count().orderBy("count", ascending=False).show()

# Compare row counts before and after cleaning
print(f"Original row count: {df.count()}")
print(f"Cleaned row count: {df_final.count()}")
print(f"Difference: {df.count() - df_final.count()} rows removed")
2.7 Summary
In this chapter, we’ve learned how to clean data effectively using PySpark within Microsoft Fabric. We explored:
- How to identify different types of data quality issues in your Fabric lakehouse
- Techniques for handling missing values, duplicates, and outliers
- Methods for transforming data types and standardizing formats
- Built-in PySpark functions that simplify the cleaning process
- Best practices for creating maintainable cleaning pipelines in Fabric
Clean data is the foundation of reliable analysis, and Microsoft Fabric provides powerful tools to perform this critical task efficiently. In the next chapter, we’ll build on these clean datasets to shape our data into forms suitable for specific analytical needs.
Remember that data cleaning is often an iterative process. As you discover more about your data in later analytics stages, you may need to revisit and enhance your cleaning processes. The flexible notebook environment in Microsoft Fabric makes this iterative approach straightforward and efficient.